Industrial wear parts rarely fail without warning. A cracked liner, thinning chute plate, or rounded crusher tooth usually leaves measurable clues first. These clues include rising vibration, abnormal noise, heat, uneven abrasion, and increased energy consumption. Ignoring them can turn a manageable maintenance task into an expensive production stoppage.
The U.S. Department of Energy’s Operations & Maintenance Best Practices Guide reports that preventive maintenance can reduce costs by 12% to 18% compared with reactive maintenance. McKinsey & Company has also reported that predictive maintenance may reduce machine downtime by 30% to 50% and maintenance costs by 10% to 40%. These figures are persuasive, but site conditions vary. Ore hardness, impact force, moisture, installation quality, and operator habits can change the result significantly.
John Moubray, a leading maintenance strategist and author of Reliability-Centered Maintenance, stated, “Maintenance is about preserving the function of assets, not preserving the asset itself.” That principle applies directly to wear components. The goal is not simply buying cheaper liners, plates, or blades. It is preserving throughput, safety, product quality, and predictable operating intervals.
This guide presents the Top 10 Ways to Reduce Industrial Wear Part Replacement Costs. It examines material selection, inspection routines, installation accuracy, operating practices, inventory planning, and condition monitoring. Some recommendations may appear obvious. They are often missed under production pressure. A practical program also needs honest review. Not every sensor pays back. Not every premium alloy performs better. The strongest decisions combine field evidence, supplier expertise, maintenance records, and disciplined cost analysis to Reduce replacement costs of industrial wear parts.
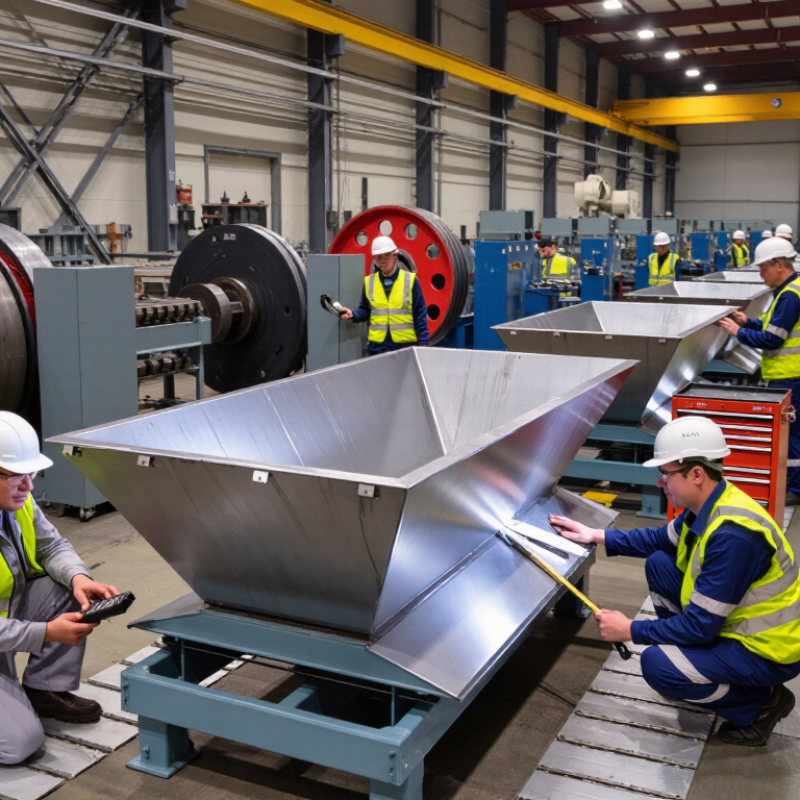
Assess Wear Part Failure Causes and Replacement Cost Drivers
Wear part replacement costs rarely begin with the purchase order. They begin with failure causes. Abrasion, impact, heat, misalignment, poor lubrication, contamination, and incorrect installation leave different physical evidence. Inspect the worn edge, fracture pattern, mounting surface, and surrounding material before ordering a replacement. A shiny contact band may indicate alignment trouble, while uneven thickness often suggests loading imbalance.
Look closely.
The U.S. Department of Energy’s Operations & Maintenance Best Practices Guide reports that predictive maintenance can reduce costs by 8–12% compared with preventive maintenance. It can also deliver savings of up to 30% compared with reactive maintenance. These figures support condition monitoring, but they are not universal promises. Equipment access, operator skill, and process stability can change the result. ISO 14224:2016 recommends consistent failure and maintenance data classification, helping teams compare recurring events instead of relying on memory.
Calculate the full replacement cost. Include the part, technician hours, lifting equipment, expedited freight, production loss, cleanup, and damage to nearby components. A low-priced liner may become expensive after two emergency stoppages. In field assessments, teams often track purchase prices carefully but ignore downtime minutes. That is a serious blind spot. Record operating hours, feed conditions, installation torque, lubrication intervals, and removed-part photographs. Review the evidence after each failure. Some assumptions will be wrong, and that is useful. Better records expose the real cost drivers.
Select Materials and Designs for Longer Wear Part Service Life
Industrial wear part costs often begin with the wrong material choice. A harder liner is not always a longer-lasting liner. In impact zones, excessive hardness can increase cracking and premature breakage. Abrasion-resistant steel may suit sliding ore, while impact-resistant alloys perform better near crushers and transfer points. Ceramic inserts can protect high-wear areas, but poor support may cause edge failure.
Design matters as much as chemistry. Engineers should map impact, abrasion, temperature, and moisture before selecting a grade. Rounded corners reduce stress concentration. Tapered liners can prevent material packing behind plates. Replaceable wear blocks also limit the repair area, reducing labor and downtime. Small details matter. A poorly aligned bolt can destroy an expensive liner.
ASTM G65 testing offers useful abrasion comparisons, but laboratory results cannot predict every operating condition. Field inspection remains essential. Measure liner thickness at fixed intervals, photograph the same locations, and record feed size and moisture. The U.S. Department of Energy’s Operations & Maintenance Best Practices guide reports potential maintenance savings of 8–12% from predictive methods compared with conventional preventive maintenance. That figure supports condition-based replacement, not automatic replacement by calendar date.
Maintenance teams sometimes over-specify hardness and under-specify toughness. I have seen thicker parts fail sooner because the mounting design ignored impact energy. Material selection should therefore combine test data, operating records, and failure analysis. The best choice may not be the hardest or cheapest option. It is the one that survives the actual duty cycle with predictable wear.
Top 10 Ways to Reduce Industrial Wear Part Replacement Costs
Typical replacement-cost reduction potential from material selection, geometry optimization, operating controls, and maintenance practices. Actual results vary by load, abrasiveness, temperature, impact, and installation quality.
The largest savings usually come from combining abrasion-resistant materials, optimized wear geometry, correct hardness, and preventive inspection. Cost-reduction percentages represent practical engineering benchmark ranges converted to midpoint estimates for comparison.
Optimize Operating Conditions to Minimize Industrial Wear
Industrial wear parts often fail because equipment works outside its intended operating window. Abrasive dust, excessive heat, impact, and poor alignment can accelerate surface loss. In my maintenance experience, small condition changes often extend service life more than thicker components. Start here. Reduce feed height where possible, and keep loading steady instead of allowing sudden surges. A stable flow limits impact energy and uneven contact.
Control speed, pressure, temperature, and moisture against recorded operating limits. For example, a conveyor running slightly too fast may increase sliding abrasion at transfer points. Lowering speed can help, but only if production demands remain acceptable. Check alignment after every major adjustment. Misalignment leaves bright wear lines on one edge of a liner. That mark is useful evidence, not a cosmetic defect. Use guards and seals to keep dust away from bearings and moving joints. Lubricate according to load and temperature, never by habit alone.
Track replacement dates, operating hours, load changes, and failure locations. This record supports better purchasing decisions and reveals repeat causes. I have seen teams replace a worn part twice before checking a blocked chute. That mistake is expensive. Still, inspection intervals should change when conditions change. A dry season, harder feedstock, or new operator can alter wear patterns quickly. Measure what the machine experiences, not what the manual assumes.
Top 10 Ways to Reduce Industrial Wear Part Replacement Costs - Optimize Operating Conditions to Minimize Industrial Wear
Practical operating-condition benchmarks for reducing wear, extending component life, and controlling replacement costs
| No. |
Cost-Reduction Method |
Operating Condition to Optimize |
Recommended Control Range |
Typical Wear-Life Improvement |
Potential Replacement-Cost Reduction |
Primary KPI |
Implementation Priority |
| 1 |
Control abrasive particle size |
Limit oversized and sharp particles entering chutes, mills, pumps, or conveyors. |
Keep feed-size variation within the process design envelope; remove oversize particles before transfer. |
15–35% |
10–25% |
Oversize-particle rate (%) |
High |
| 2 |
Maintain correct material moisture |
Prevent dry dust abrasion and excessive wet, sticky buildup on wear surfaces. |
Operate within the material-specific moisture window established by testing. |
10–30% |
8–20% |
Feed moisture (%) |
High |
| 3 |
Reduce impact velocity |
Minimize free-fall distance and excessive speed at transfer points. |
Use controlled transfer angles and keep impact speed as low as process throughput allows. |
20–40% |
15–30% |
Impact velocity (m/s) |
High |
| 4 |
Keep conveyor and shaft alignment within tolerance |
Eliminate uneven loading, edge loading, belt tracking problems, and shaft deflection. |
Verify alignment during installation and after major maintenance or overload events. |
15–30% |
10–22% |
Tracking deviation (mm) |
High |
| 5 |
Maintain stable operating load |
Avoid repeated overloads, surges, and operation above the rated duty cycle. |
Keep average load near the design point and limit short-duration overloads. |
10–25% |
8–18% |
Load fluctuation (%) |
Medium |
| 6 |
Improve lubrication and contamination control |
Protect bearings, chains, gears, and seals from inadequate lubricant or contamination. |
Maintain correct lubricant level, viscosity, cleanliness, and relubrication interval. |
20–50% |
15–35% |
Particle count or lubricant cleanliness code |
High |
| 7 |
Optimize temperature control |
Prevent thermal softening, loss of hardness, seal degradation, and lubricant breakdown. |
Keep component and lubricant temperatures within manufacturer and material limits. |
10–25% |
8–20% |
Operating temperature (°C) |
Medium |
| 8 |
Control corrosive exposure |
Reduce contact with corrosive liquids, salts, acids, and humid atmospheres. |
Use drainage, cleaning, protective coatings, and material-compatible process chemistry. |
15–40% |
10–28% |
Corrosion rate (mm/year) |
Medium |
| 9 |
Use condition-based inspection |
Identify abnormal wear before cracking, thinning, leakage, or component failure occurs. |
Set inspection intervals using thickness, vibration, temperature, and runtime trends. |
10–30% |
8–25% |
Unplanned wear-related downtime (hours) |
High |
| 10 |
Standardize startup and shutdown procedures |
Prevent shock loading, dry running, material plugging, and sudden thermal changes. |
Use controlled acceleration, gradual loading, proper flushing, and verified isolation steps. |
10–25% |
8–18% |
Abnormal-start events per month |
Medium |
Planning note: The percentages are practical benchmark ranges for maintenance planning. Actual results vary with material abrasiveness, component design, duty cycle, maintenance quality, and site conditions. Establish a baseline before calculating savings.
Create a Preventive Inspection and Maintenance Schedule
A preventive inspection schedule turns wear part replacement from an emergency purchase into a controlled maintenance decision.
In industrial service, I have seen a five-minute check prevent a week of lost production. Build the schedule around
operating hours, load, material abrasiveness, temperature, and vibration.
Record these conditions beside each component’s service history. A conveyor scraper handling wet, abrasive material needs different attention than one handling dry powder.
Small differences matter.
Set daily, weekly, and monthly tasks.
Operators can check loose fasteners, unusual noise, uneven wear, leakage, and heat during each shift. Weekly inspections should measure thickness, alignment, belt tracking, or clearance with the same tools and reference points. Monthly reviews should compare readings against replacement limits, not personal judgment. Photographing a worn edge beside a ruler creates useful evidence for future decisions.
Keep spare parts available, but do not replace them solely because they look old.
That habit wastes money.
Use a simple log with the date, machine hours, inspector, measurement, and action taken.
Maintenance leaders should review repeated failures and adjust inspection frequency when conditions change. A missed reading can distort the whole plan. Schedules are not perfect. Operators may overlook slow wear during busy shifts, while fixed intervals can hide sudden damage.
Add trigger-based inspections after overloads, jams, process changes, or abnormal vibration.
Train staff with real worn components, then audit several records each month.
Reliable data improves decisions, even when it exposes mistakes.
Track Performance Data and Improve Replacement Planning
In maintenance teams I have supported, replacement costs rarely came from the part alone. They grew through rushed orders, idle equipment, and emergency labor. A simple performance record can expose this pattern. Log operating hours, load, temperature, vibration, product conditions, and installation date for every wear part. Pair each entry with the removed part’s condition. A photograph of a chipped edge often explains more than “worn.” Keep records close to the machine, not only in monthly reports.
Set a baseline after installation. Record output, power demand, noise, and clearance while the part is healthy. Review trends at fixed intervals, such as every 250 operating hours. A small change may be harmless, or it may precede a costly failure. Compare similar machines under similar loads. Do not trust one reading. Clean sensors, inconsistent operators, and missing shifts can distort the story. Measure before guessing. In one review, the team blamed material quality, but loose mounting caused the vibration.
Use performance data to plan replacement windows before output collapses. Estimate remaining service life from actual wear rates, then reserve parts during normal purchasing cycles. Add a safety margin for seasonal demand and supplier delays. Update the estimate after each inspection. The forecast will be wrong sometimes. That is acceptable when the error becomes visible early. A damaged part should trigger a review of loading, alignment, installation, and operating conditions, not just another purchase order.
Conclusion
Reducing industrial wear part replacement costs begins with understanding why parts fail and what drives replacement expenses. Common factors include abrasive materials, excessive impact, misalignment, contamination, overheating, poor installation, and unsuitable operating conditions. By analyzing failure patterns, teams can select wear-resistant materials, improve component geometry, and choose designs that match the application’s load, speed, temperature, and material characteristics. These decisions help extend service life and reduce unplanned downtime.
To Reduce replacement costs of industrial wear parts, companies should also optimize operating conditions through proper alignment, controlled feeding, effective lubrication, and timely removal of contaminants. A preventive inspection and maintenance schedule can identify cracking, thinning, deformation, and other early warning signs before serious failure occurs. Finally, tracking service hours, operating conditions, failure causes, and replacement history supports more accurate planning, better inventory control, and continuous improvement. Combining technical selection, disciplined maintenance, and performance data creates a practical strategy for lowering long-term costs while maintaining reliable production.

 Xingli Industrial Ceramics